Earnings intelligence for UK & US stocks
Spot what's changing in a company before the market does.
Omenti reads every UK company announcement within minutes, tracks the evidence behind earnings (order books, trading updates, demand, costs) and shows how much of it is still to be priced in. Built on official data and tested against years of UK results.
- Every UK announcement, read in minutes
- 1,300 UK companies checked every morning
- Tested on years of UK results
- UK & US listings
Every morning from 7:00
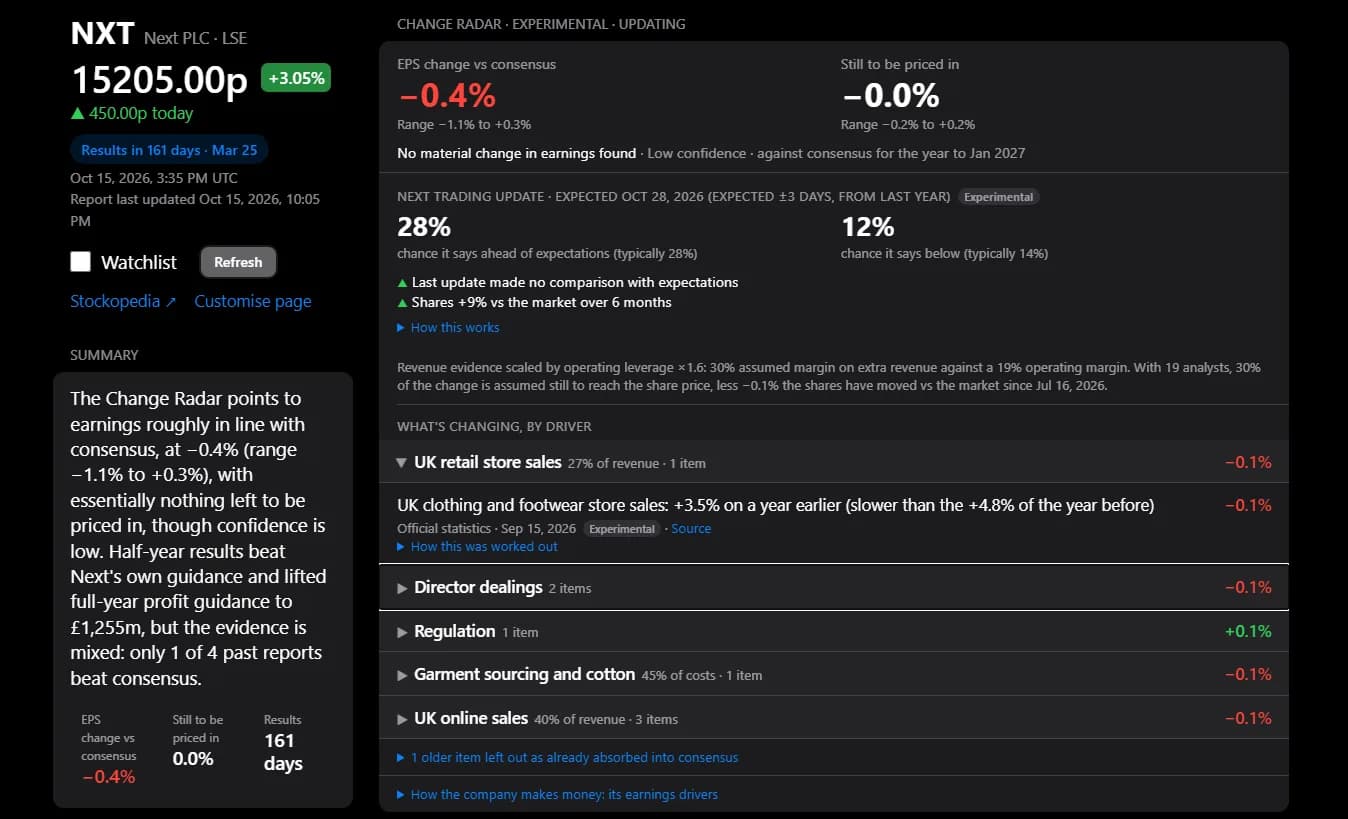
The Daily Briefing: today's news, read and ranked
Every price-sensitive announcement from UK-listed companies, read by AI within minutes of release. The biggest beats and the biggest warnings come first, each with what it said against expectations, the typical share price move for that verdict in past UK trading updates, and how tradable the shares are: market cap, value traded and a rough spread.
Before the brokers
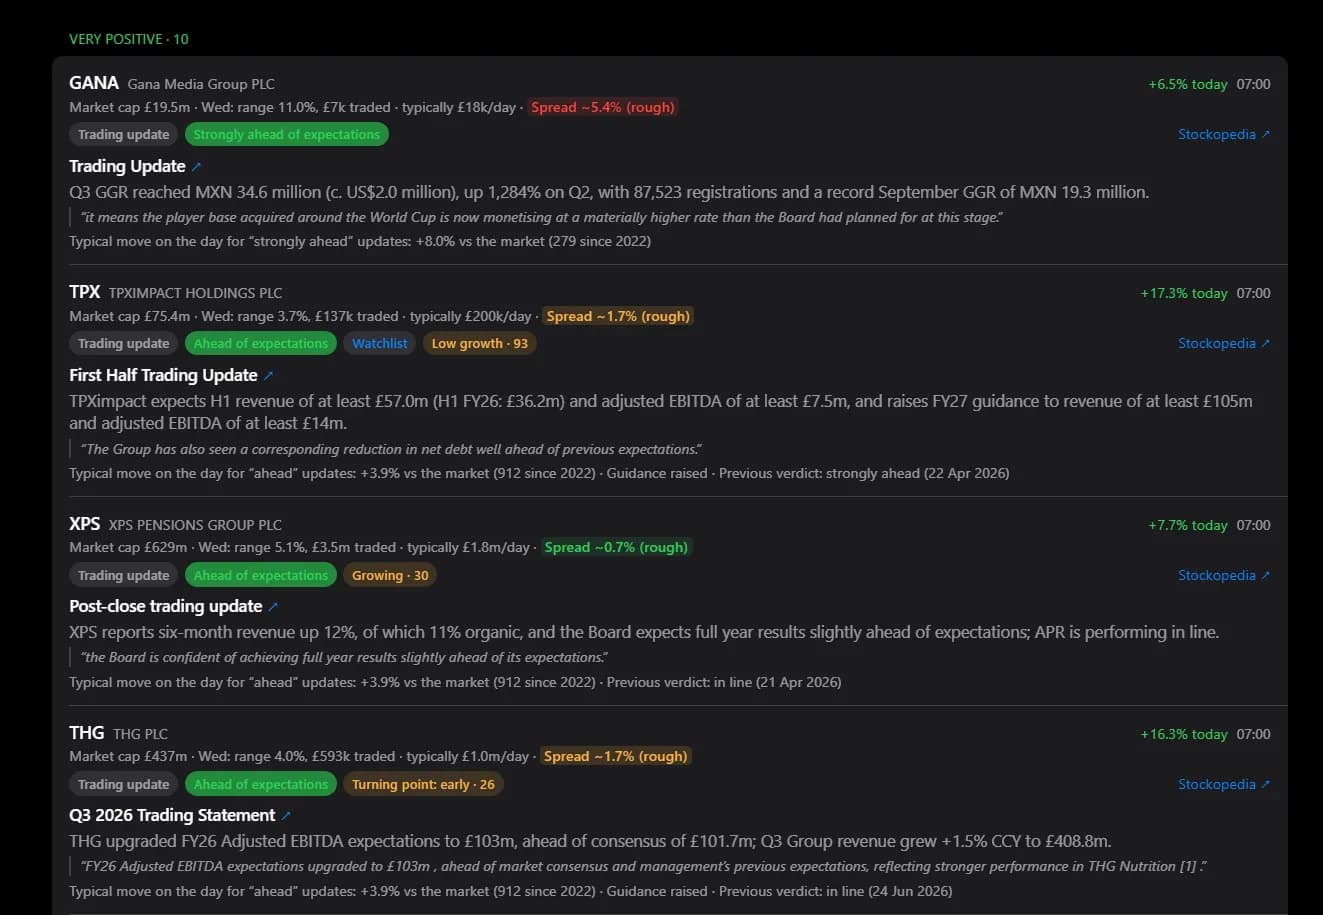
The Change Radar: where earnings are heading
Omenti maps how each company makes its money, then gathers the evidence for each earnings driver and turns it into an estimated change in earnings against analysts' consensus. It also shows how much of that change the share price has yet to reflect.
- Results, trading updates and other company filings, read by AI
- Director dealings and short positions
- Public contract awards
- Official demand statistics (ONS, US government data)
- Input costs and currencies
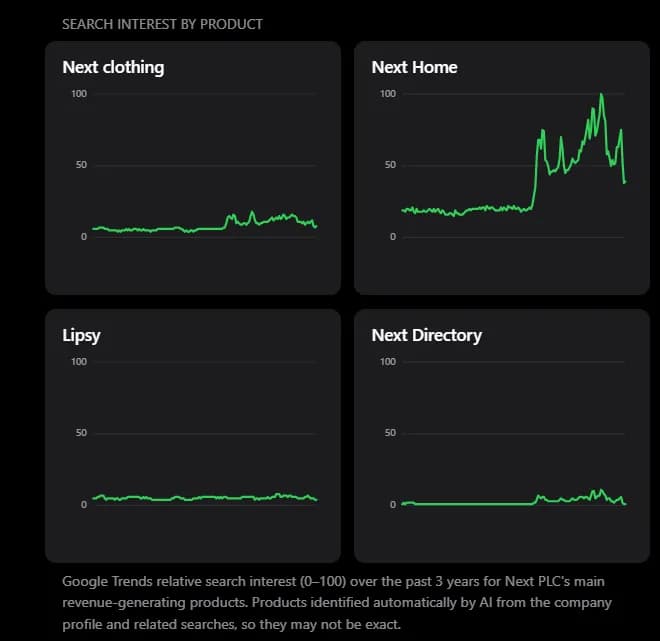
- Search interest, where it really measures demand
Each measure is checked against the company's own reported revenue before it counts.
Growth & turning points
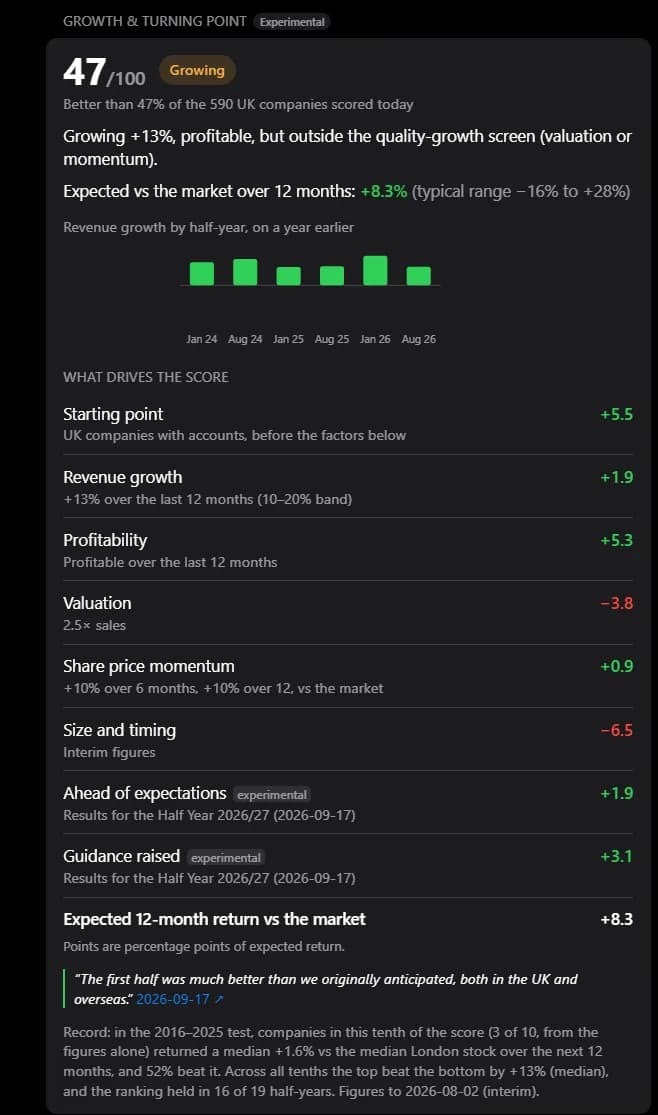
Is this the start of a growth story?
Every UK company gets a score from 0 to 100, ranking its expected 12-month return against the rest of the market. It's built from profitable growth at a fair price, share price momentum and what the company has just announced, such as a record order book or raised guidance.
A stage explains the picture: hidden growth, a turning point after a big fall, growth that's already priced in, or warnings such as loss-making growth and growth rolling over.
In tests on 2016–2025 results, the top tenth of companies by score beat the median London stock by about 6% a year, and the bottom tenth lagged it by about 7%. Past test results are no guarantee of future returns.
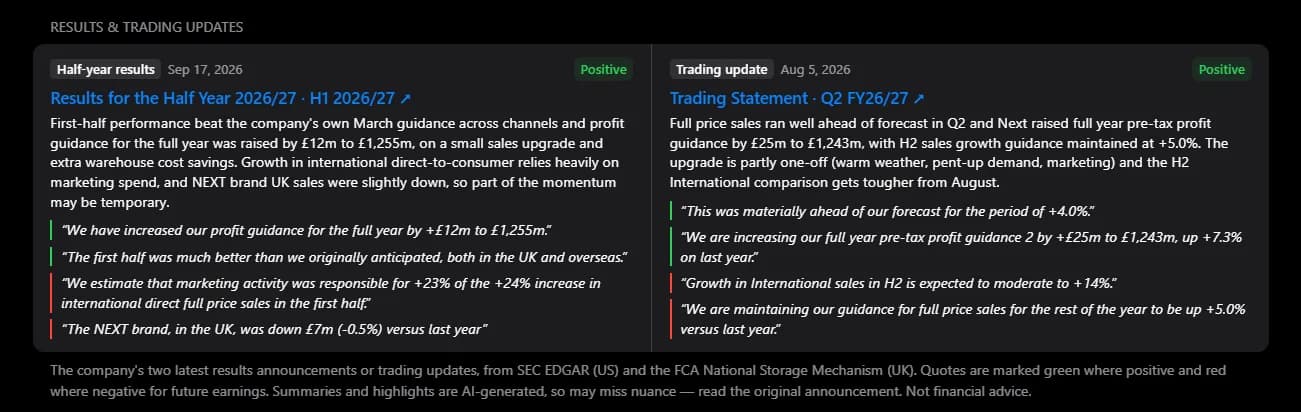
In the company's own words
Every results statement, read for what matters
Results and trading updates from the FCA's National Storage Mechanism and SEC EDGAR, summarised, marked ahead of, in line with or below expectations, with the sentences that matter quoted and linked to the original.
The whole UK market
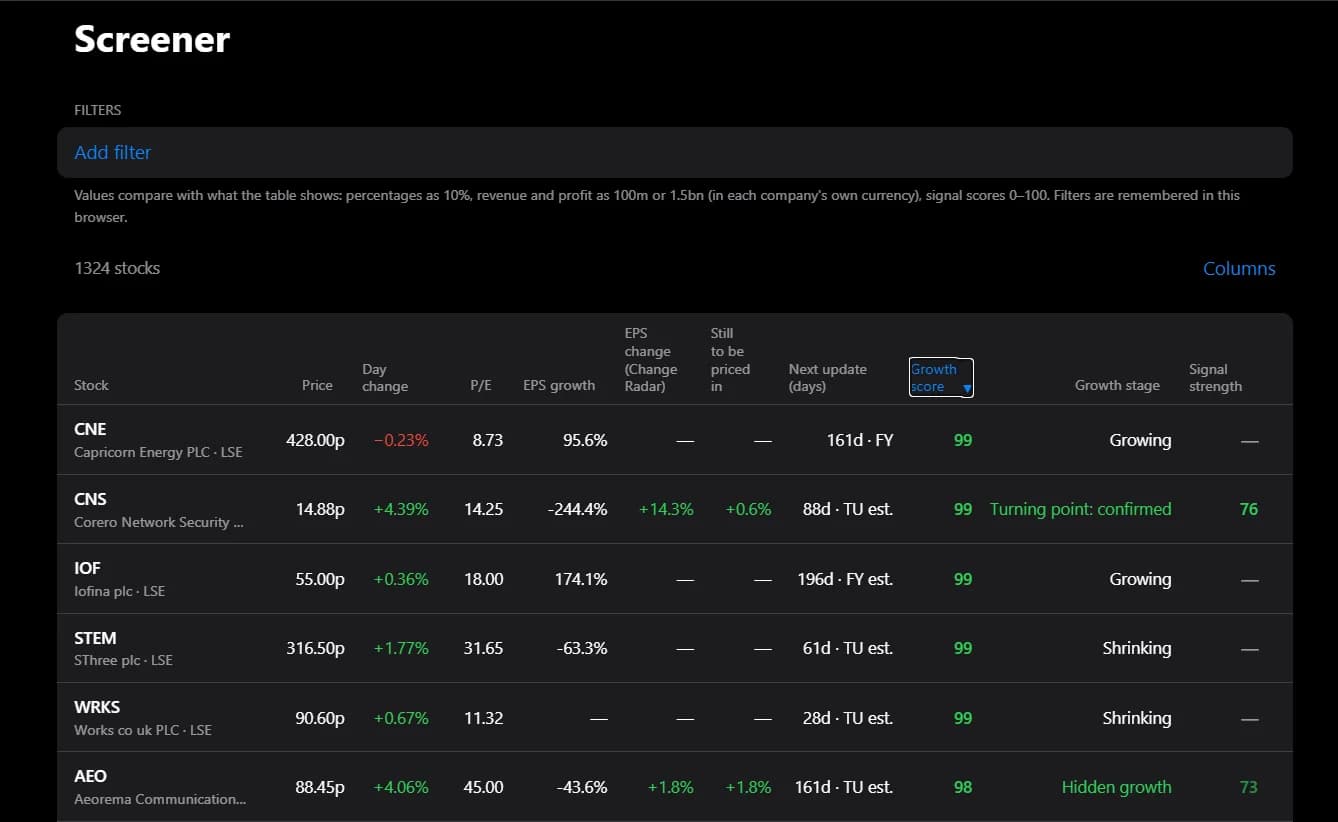
Screen every listed UK company
Every listed UK company, refreshed each morning: growth score and stage, Change Radar figures, valuation and the date of its next update. Pick your columns, filter on any of them, and sort.
Your watchlist keeps the same figures for the stocks you follow, UK and US.
Know what's coming
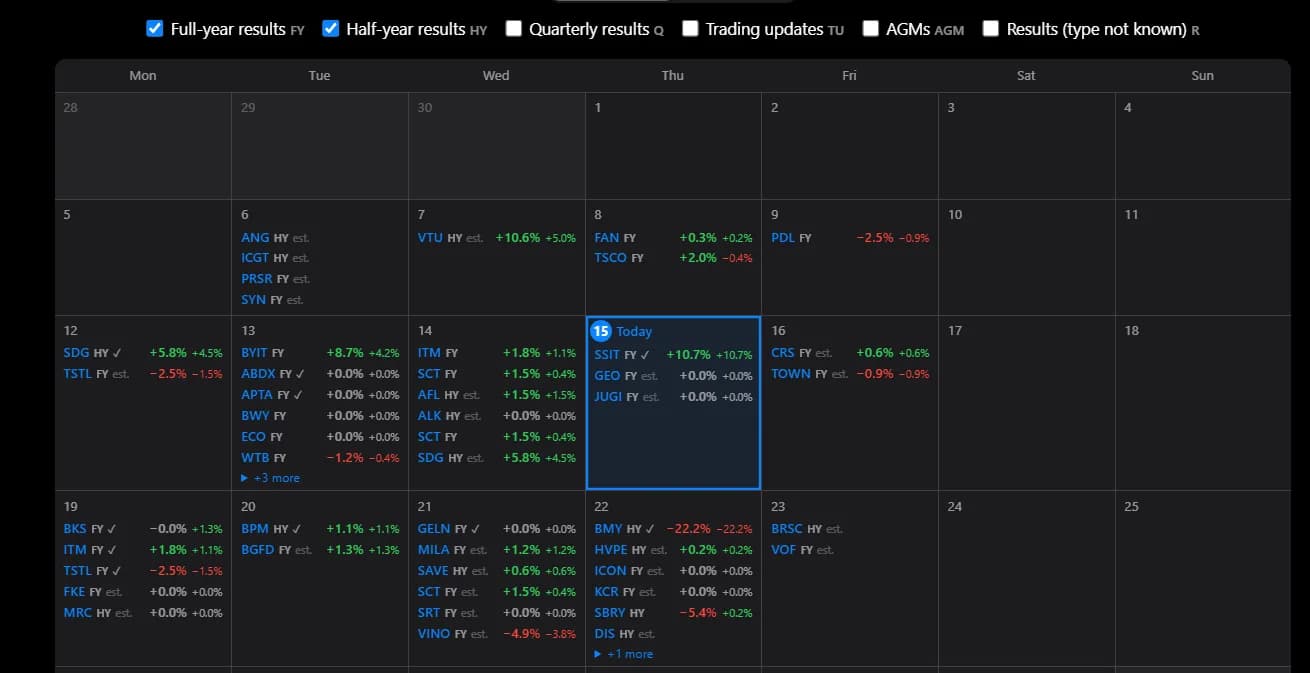
Every UK results date, from the companies' own filings
Results, trading updates and AGMs for every UK-listed company, taken from their notices to the FCA (marked confirmed), market data, or the pattern of previous years.
Filter by announcement type or by your watchlist, and see each stock's Change Radar beside its date.
How it works
- 1
Start with the Daily Briefing
Every UK announcement since yesterday, read and ranked, by 7:05 on most days.
- 2
Open any stock
The Change Radar, growth score and AI-read updates for UK and US listings, in one page you can arrange.
- 3
Check the evidence
Every figure links to the filing, quote or statistic behind it, with its assumptions spelled out.
Built to be checked
Official sources
FCA filings, SEC EDGAR, ONS and government statistics, alongside market data.
Quotes checked
Anything AI reads is kept only if its quoted sentence really appears in the source.
Tested, then shown
Signals earn weight by holding up on past UK results; untested ones are labelled experimental.
Logged for scoring
Estimates are saved daily so they can be checked against what actually happened.
See the change before the price does.
We're not taking new accounts just yet. Join the list and we'll tell you when we are.